Features
Everything you need to read your ecommerce, in one place
Ten features with metrics defined once: what you see on the home, on a dashboard or in an answer of the assistant comes from the same calculation.
The ten features
Pick one to go straight to it; each with what it does and where its figures come from.
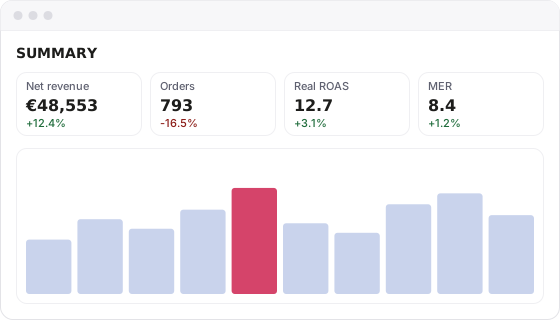
A home with what matters
Net revenue, orders, spend, real ROAS, MER, sessions and conversion, against the previous period and last year.
- Quick periods (today, yesterday, 7, 28 and 90 days, month, quarter and year) and custom dates.
- Net sales of the shop, after returns and cancellations.
- The spend of the advertising platforms, added up the same way.
- Every figure says how it is calculated and which connection it comes from.
More detail
The first screen answers «how are we doing?»: the key figures of the period you choose, compared with the previous one and with the same period last year.
Yearly tracking against targets
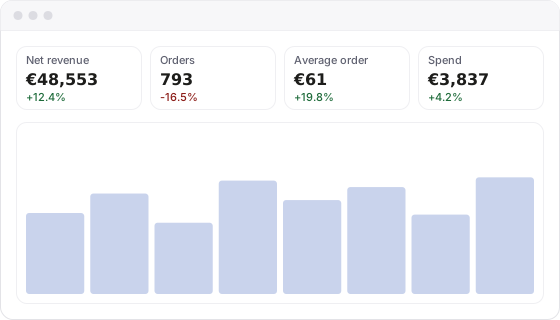
Sales of each month against the target and last year, with the marketing cost and an estimate for the current month.
- Colours that warn when a month falls below the target.
- A view of the total, the website and the marketplaces.
More detail
A table with the twelve months of the year: what was sold, the target, last year and the marketing cost. The current month carries an estimate of how it will close, so you see in time whether you will make it.
Targets and costs
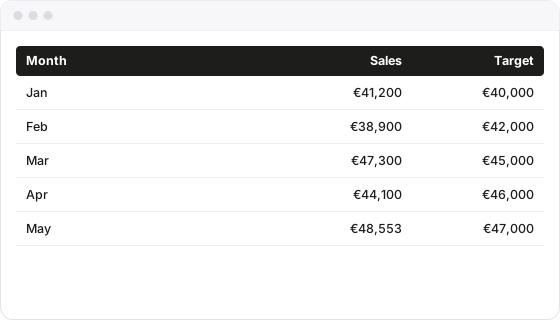
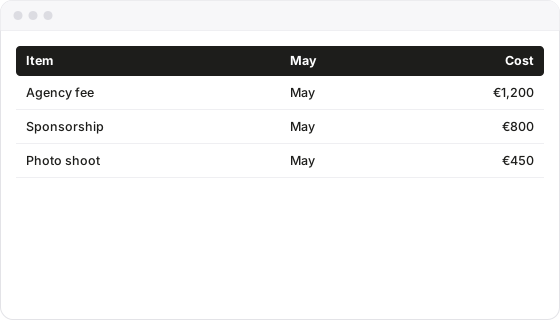
The targets of each month and the costs that do not come from the platforms, so the marketing % and the ROAS work themselves out.
- A whole year loaded from a spreadsheet.
- Costs by month and by item.
More detail
You enter the sales targets and the costs the platforms do not bring, such as the agency fee or a sponsorship. The marketing share of sales and the ROAS are calculated from there.
Explorer
Cross metrics and dimensions (channel, campaign, product, country, device) without knowing about databases.
- Table and chart at once, compared with the previous period.
- Export to CSV and Excel, large tables too, in the background.
More detail
For the questions a dashboard does not answer. You choose metrics and dimensions, filter and compare periods. What you find can be added to a dashboard.
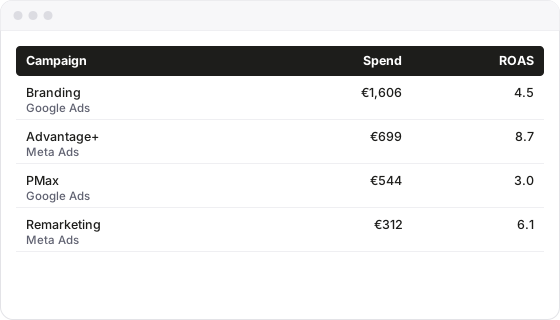
Custom dashboards
Dashboards with the charts and tables each team uses, shared with its people.
- Line and bar charts, tables and key figures.
- One period for the whole dashboard or one per block.
- Shared with the team of the project or with the view of a group of projects.
More detail
Management, marketing and ecommerce look at different things. Dashboards bring together each one’s charts and tables and are shared with the team of the project.
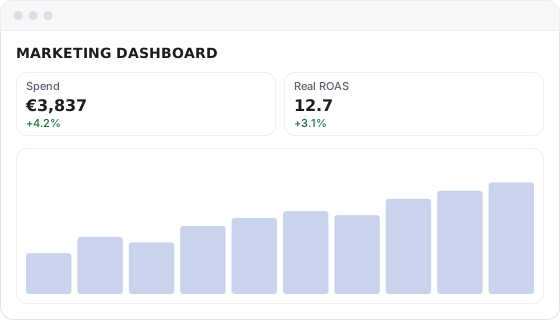
AI assistant
Ask «why did sales drop?» and get the breakdown by channel, campaign and product, with the source of each figure.
- It explains changes between periods and relates them to the milestones you noted.
- It suggests the next useful questions.
- It uses Claude, by Anthropic, and only receives aggregated figures, never data of your buyers.
More detail
The assistant reads the figures of the project and answers in plain language. It says which metrics and connections each figure comes from, and it only sees the projects you have access to.
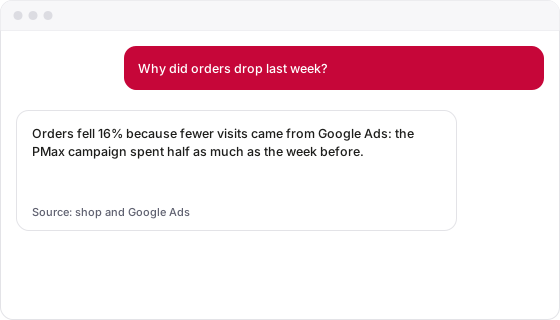
Reports and daily digest
Template reports that flag what is out of the ordinary, and a digest every morning by email.
- A daily email digest of the checkout and email reports, if you turn it on.
- The console marks the connections that need reconnecting.
More detail
Report templates gather what each team looks at. The checkout health and the email and CRM reports flag what is out of the ordinary and can reach you every morning by email.
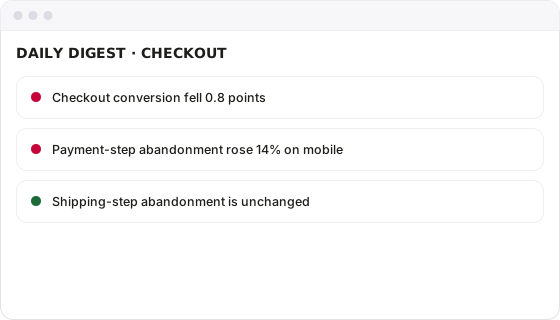
Milestones
Note launches, sales or website changes and see them on the charts.
- Milestones of a project or of the whole account.
- Shown on the charts, in the reports and in the assistant.
More detail
A price change, the start of the sales, the website going down. Milestones are noted with their date and show on the charts and in the answers of the assistant, to understand why a figure changed.
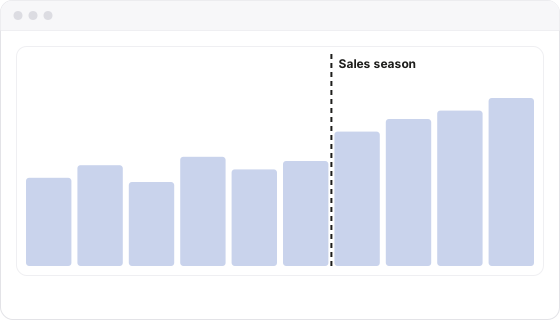
Channels and physical stores
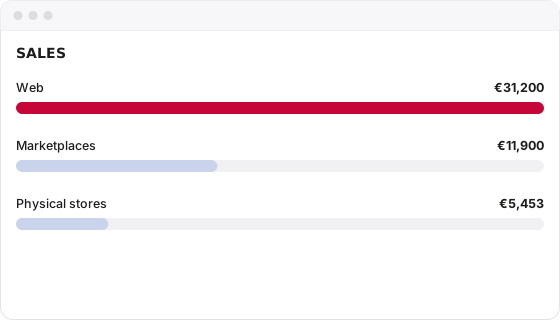
Keep the website, marketplaces and physical stores apart with their own rules, and choose which sales count in each view.
- A default scope for the project, for example only the website.
- Leave out the channels you do not want to add up.
- In the Professional and Agency plans.
More detail
If you sell on your website, on marketplaces and in physical stores, each channel has its own reading. Channel and store rules sort every order and decide what counts in each view.
Projects, team and permissions
Create projects, connect your sources and invite your team.
- Unlimited users in every plan.
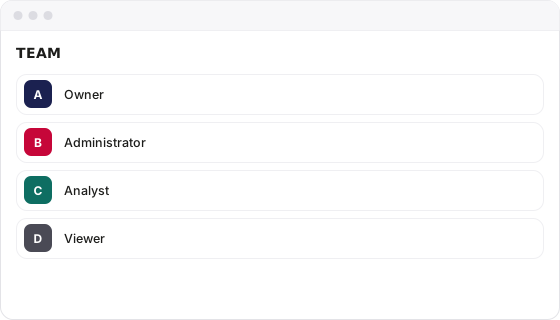
- Owner, admin, analyst and viewer roles.
- Two-factor authentication required for owners and admins.
- If you reach a limit, you ask for more from the console itself.
More detail
Each account creates its projects and connects its sources, up to the limits of its plan. People sign in with their own access and only see what they are given.
All your ecommerce figures, in one place
Sales, advertising, analytics and SEO of your projects, reconciled and explained. Invitation-only beta.